

Conversion Rate Optimization: Diagnose Your Top Page in 30–90 Days

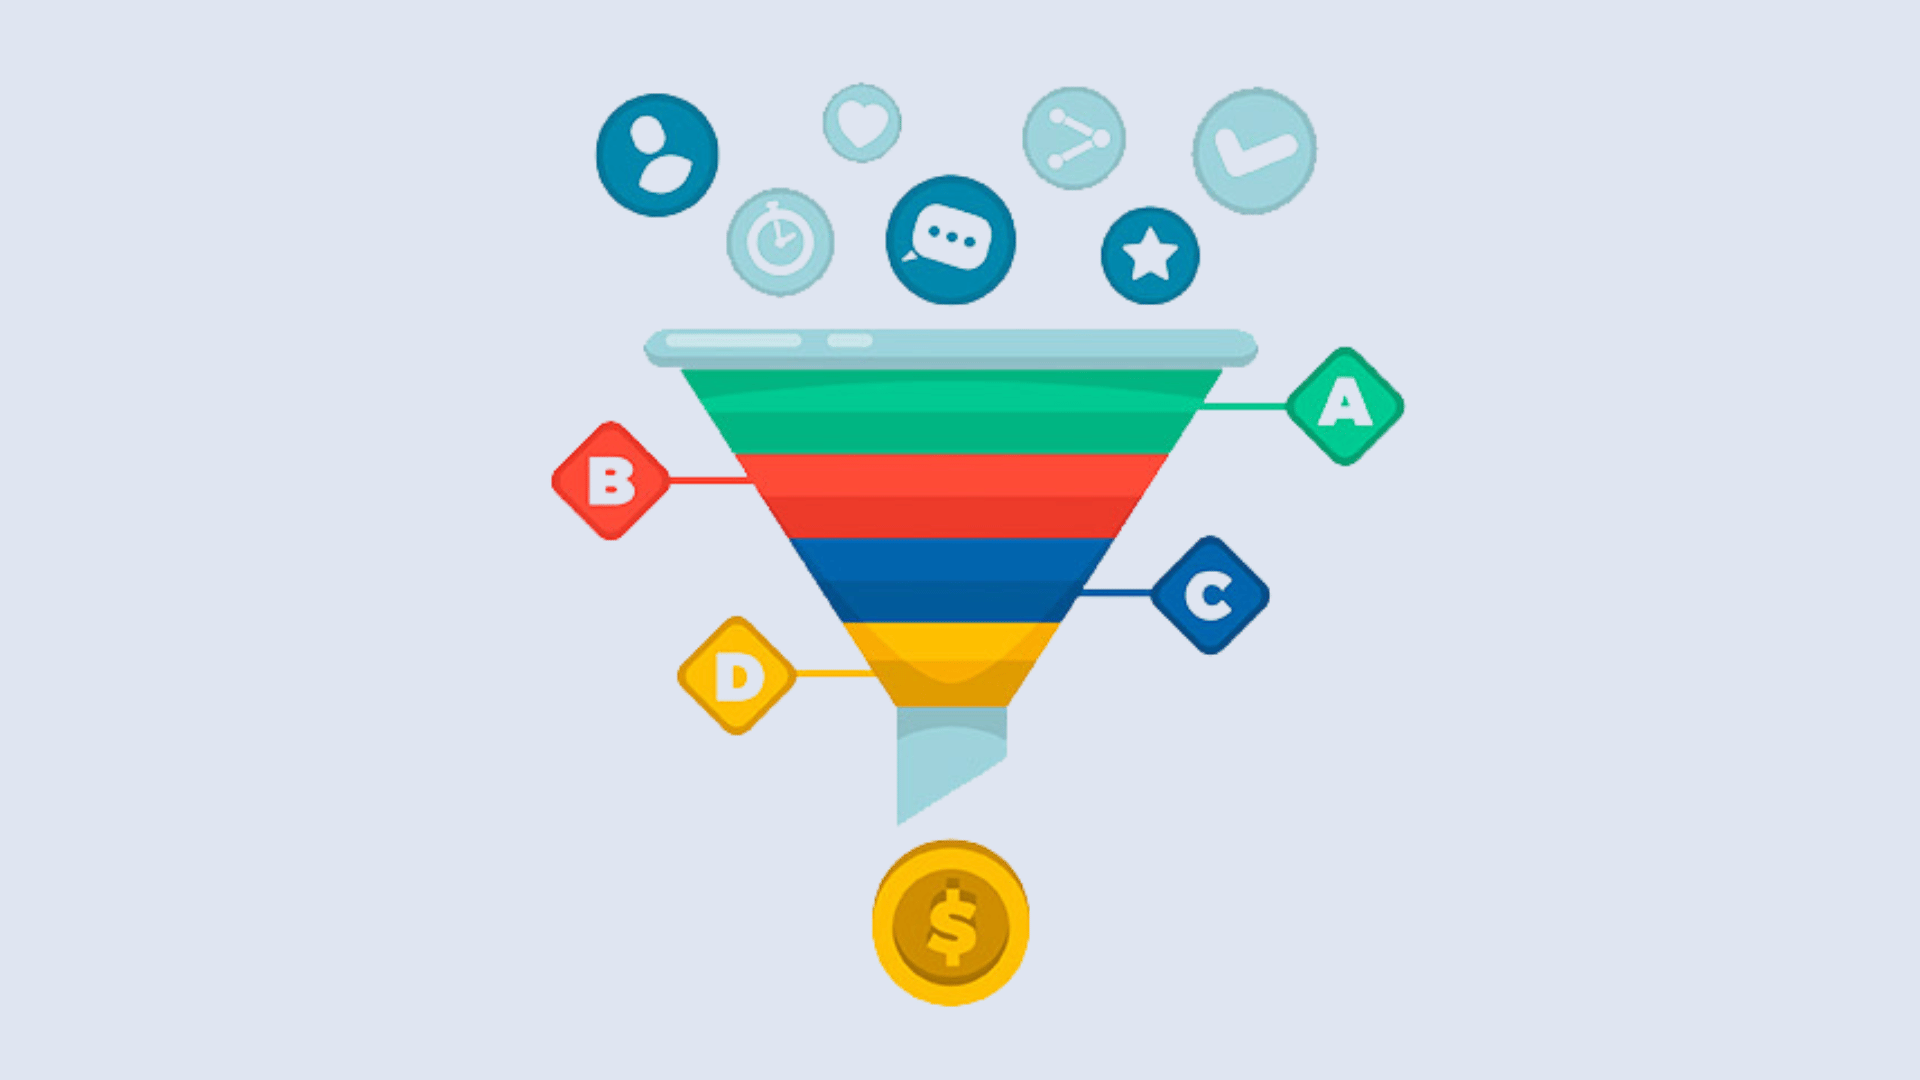
Conversion rate optimization is the systematic, data-driven process of increasing the share of visitors who take a desired action, without spending more to acquire them. The single highest-impact first move is diagnosing the one page that drives most of your conversions right now, using a real baseline from analytics and a behavioral tool like Microsoft Clarity, before you touch a headline, button, or form.

Table of Contents
Why Conversion Rate Optimization Matters for Revenue, Not Just Metrics
CRO earns its budget line because it improves revenue per visitor without raising acquisition spend. You’re already paying for the traffic. The question is whether your site converts enough of it to justify that spend, or whether you’re quietly leaking money on every session that leaves without acting.
Average conversion rates sit roughly between 2% and 5% across industries, though ecommerce often runs closer to 1% to 4% while SaaS trial signups can land higher. Those numbers are useful context, but chasing an industry average misses the point. A relative lift on your own segmented baseline, moving from 2% to 3% on your highest-traffic landing page, often beats matching a benchmark that doesn’t reflect your audience or offer.
CRO should outrank pure traffic acquisition on your priority list whenever any of these apply:
- Your paid acquisition costs are climbing faster than revenue per customer.
- You have meaningful traffic (thousands of monthly sessions) but a conversion rate below your own historical average.
- Sales or support teams report the same friction points repeatedly, such as confusing pricing pages or forms that ask for too much too soon.
- A funnel step shows a sharp, unexplained drop between two stages that traffic growth won’t fix.
The outcomes compound. A software company that lifts trial-to-paid conversion by even a few points can see that gain repeat every month without new ad spend. A services firm that improves demo-booking rates gets more qualified conversations from the same inbound volume. That’s the actual argument for CRO in a budget meeting: it’s the lever that makes your existing traffic worth more.
The Conversion Rate Optimization Process: A Step-by-Step Workflow
CRO works as a disciplined, repeatable cycle, not a one-off redesign. Practitioner consensus frames it as diagnosis first, then hypothesis, then validated experimentation, with documentation at every stage so the program compounds instead of starting from zero each quarter.
- Define goals and guardrails. Pick one primary metric (say, checkout completion) and at least one guardrail metric (average order value, lead quality) so a “win” on paper doesn’t quietly damage revenue.
- Set your baseline. Pull 30 to 90 days of data on the page or flow in question, segmented by device, traffic source, and new versus returning visitors.
- Research, quantitative and qualitative. Mine analytics for drop-off points, then layer in heatmaps, session recordings, and direct feedback to understand why people are leaving.
- Write hypotheses. Every hypothesis should name the observed problem, the supporting evidence, the proposed change, and the expected outcome.
- Prioritize. Score each hypothesis on likely impact, your confidence in the evidence, and the effort to build and ship it.
- Test. Run the experiment long enough to reach a trustworthy result, not until the numbers happen to look good.
- Measure and document. Record what happened, including guardrail metrics, whether the test won, lost, or came back inconclusive.
The minimum artifacts worth keeping are a baseline report, a one-page hypothesis brief per test, a test plan with your success criteria written down before launch, and a running learning log. Skip the log and you’ll re-test the same idea eighteen months from now, having forgotten you already tried it.
Cadence depends on traffic. A site with 20,000 monthly sessions to a checkout flow might realistically run three to four well-powered tests a quarter. A site with 200,000 sessions can often run six to eight. Fewer, better-evidenced tests consistently beat a high volume of guesses, because each test that actually resolves (win or lose) teaches you something the next hypothesis can build on.
How to Measure Conversion Rates and Calculate Baselines
The formula is simple: conversions divided by total visitors, multiplied by 100. If 3,000 sessions produce 90 completed purchases, your conversion rate is 3%. The complexity isn’t the math, it’s picking the right denominator.
Sessions, users, and eligible population all give different numbers, and mixing them up is a common source of false confidence. If you’re measuring checkout completion, your denominator should be visitors who reached the checkout step, not total site traffic. Counting every homepage visitor in a checkout-conversion calculation understates the real friction, because most of those visitors were never eligible to convert at that step in the first place.
Separate primary conversions from micro conversions before you start reporting wins:
- Primary conversions are the business outcome: a purchase, a signed contract, a booked demo.
- Micro conversions are supporting signals: email signups, video views, added-to-cart events.
- Guardrail metrics protect against a hollow win: lead quality score, revenue per visitor, refund rate, support ticket volume.
Pro Tip: Watch revenue per visitor alongside conversion rate. A test that raises signups but drags down revenue per visitor usually means you attracted the wrong visitors, not more of the right ones.
A disciplined program defines these guardrails alongside the primary goal from the start, specifically to catch the scenario where signups go up but lead quality quietly craters. That single habit prevents more bad “wins” than any testing tool ever will.
Diagnosing Friction: Research Tools and Behavioral Signals
Analytics tells you where people drop off. It rarely tells you why. That’s the gap behavioral and qualitative research exist to close, and skipping straight from a funnel report to a hypothesis is how teams end up testing button colors instead of fixing the thing that’s actually broken.
Start with GA4 funnel and cohort reports to find the exact step where visitors abandon. Once you know where, layer in:
- Heatmaps and session recordings. Tools like Microsoft Clarity show where users click, hover, and rage-click, exposing friction that aggregate numbers can’t. A CTA that’s technically visible but consistently ignored shows up instantly on a recording.
- On-site surveys. A single exit-intent question (“What stopped you from completing this today?”) often surfaces the exact objection your copy never addressed.
- Sales and support notes. Frontline teams hear the same objections dozens of times a week; that raw feedback is free qualitative research most CRO programs never touch.
- Customer interviews. Five to eight conversations with recent buyers or recent bounces usually reveal more than another week of dashboard-staring.
Session replay combined with quantitative drop-off data produces testable hypotheses with far more confidence than either signal alone. A comprehensive CRO stack pairs analytics like GA4 with a behavioral layer and an experimentation platform to close the loop from observation to validated fix.
Pro Tip: If three separate signals (a heatmap, a support ticket theme, and a survey response) all point at the same friction point, you don’t need a fourth data source. You need a hypothesis and a test.

Designing A/B Tests You Can Actually Trust
A trustworthy experiment starts with a hypothesis written before a single line of code changes, not a vague sense that “the new version looks better.” Use a consistent template:
- Observed problem: what the data shows (e.g., 60% of mobile users abandon the form at the phone-number field).
- Supporting evidence: the specific signal, such as a session recording showing repeated field re-entry.
- Proposed change: remove the phone-number field or make it optional.
- Expected outcome: form completion rate increases without a drop in lead quality (your guardrail).
Once the hypothesis is written, set your minimum detectable effect, or MDE, which is the smallest lift you actually care about catching. Chasing a 1% lift on low-traffic pages requires enormous sample sizes; chasing a 15% lift on a high-friction step needs far less. Run-length should account for at least one full business cycle (typically one to two weeks minimum) to smooth out day-of-week effects, and you should decide your sample size and run-length before launch, not adjust them as results trickle in.
When you don’t have access to a formal sample-size calculator, a rough shortcut works: estimate your current conversion rate, decide the smallest lift worth detecting, and don’t call a result until each variant has cleared a few hundred conversions, not a few dozen. Thin sample sizes produce results that feel definitive and aren’t.
Three mistakes derail otherwise sound experiments:
- Sample ratio mismatch: if your test is supposed to split traffic 50/50 and you’re seeing 55/45 or worse, something in your setup is broken, and every result downstream is suspect.
- Peeking: checking results daily and stopping the moment they look good inflates false positives dramatically. Decide your run-length in advance and stick to it.
- Underpowered tests: ending a test early because traffic is light produces a coin flip dressed up as a conclusion.
Prioritizing Experiments: A Scoring Framework for Bigger Wins
Not every good idea deserves a slot on the roadmap this quarter. A version of the ICE framework (impact, confidence, effort) adapted for CRO gives you a repeatable way to rank hypotheses instead of testing whatever the loudest stakeholder suggested last.
Score each hypothesis 1 to 10 on:
- Impact: how much this could move your primary metric if it wins.
- Confidence: how strong the supporting evidence is (a session-recording pattern seen 40 times scores higher than a hunch).
- Effort: how much design and engineering time it takes to build and ship.
A headline rewrite addressing a value-clarity problem you’ve seen in five user interviews might score high impact, high confidence, low effort, an easy priority. A full checkout redesign might score high impact but low confidence and high effort, worth doing eventually, not first.
For a 90-day roadmap: a small site (under 10,000 monthly sessions to the page in question) might run two to three tests total, prioritizing high-confidence messaging fixes since low traffic limits statistical power. A medium site can typically run four to six. A large site with high-traffic pages can run eight or more, including riskier, higher-effort tests that smaller sites can’t afford to gamble on.

The Tactics That Actually Move Conversion Rates
Some changes consistently outperform others, and the pattern holds across most sites: messaging and offer clarity fixes tend to produce larger swings than purely visual or cosmetic changes, unless the visual design is actively broken.
- Apply the Rule of One. One core message, one primary offer, one clear next step per page. Pages that try to say five things say nothing clearly.
- Test the headline and subhead before anything else. If a visitor can’t understand what you do and why it matters in five seconds, no button color will save the page.
- Make your call-to-action specific. “Start Your Free Trial” outperforms “Submit” because it restates the value, not just the action.
- Put proof near the CTA. A specific result or case metric placed right beside the button reduces hesitation at the exact moment someone is deciding. Most shoppers read reviews before buying, which makes social proof one of the highest-leverage placements on a page.
- Cut form fields ruthlessly. Ask only for what you need at this step, and use progressive profiling to collect the rest later, once trust is established.
- Fix mobile UX and page speed first if your traffic is majority mobile. A CTA that’s occluded by a sticky header on mobile, or a page that takes four seconds to load, kills conversions before your copy even gets a chance.
- Use personalization and AI carefully. AI-assisted tools can speed up hypothesis generation and copy variants, and platforms built for rapid AI-assisted prototyping can help you spin up test variants faster, but every AI-suggested change still needs the same evidence and testing discipline as any other hypothesis.
Pro Tip: Before testing a new hero image, test your headline. Design-only changes usually produce small marginal gains unless the underlying message is already sharp; copy and offer changes tend to move the needle harder.
Where Conversion Rate Optimization Programs Go Wrong
The costliest mistake is testing cosmetic changes, button colors, minor layout tweaks, before fixing an unclear value proposition or messaging problem. A beautifully designed page that doesn’t explain what you’re offering will underperform a plain page that does.
- Testing polish before clarity wastes your best traffic on the wrong question.
- Running a test with insufficient traffic produces a coin-flip result dressed up as data; if your page gets a few hundred sessions a month, an audit and qualitative research will teach you more than a formal split test.
- Calling a test a “loss” and moving on without documenting why wastes the one valuable thing a failed test produces: a learning.
- Treating an inconclusive result as a failure, rather than as evidence you need a bigger effect size or a different hypothesis, causes teams to abandon good ideas too early.
Turning CRO Into an Ongoing Capability
A single successful test doesn’t make a program. What makes CRO compound is documentation and ownership that outlast any one campaign.
- Assign clear roles. Someone owns the experiment roadmap, someone owns implementation, and someone owns the learning log. Without an owner, tests stall in the backlog.
- Keep a test registry. Every experiment, win, loss, or inconclusive, gets logged with its hypothesis, result, and guardrail impact so lessons compound instead of getting repeated.
- Report results in business terms. Translate “conversion rate increased 1.2 points” into “an estimated $40,000 in additional annual revenue at current traffic” when you present to stakeholders; that’s the version that keeps CRO funded.
- Tie the roadmap to company goals. A test backlog that ignores the quarter’s actual revenue priorities won’t survive the next budget review.
Design Sprints and Rapid MVPs: Applied Diagnosis in Practice
Conversion rate optimization diagnosis can be run through structured frameworks rather than open-ended redesigns. The Design Sprint compresses research, hypothesis-building, and prototyping into a tight, focused window instead of a months-long process, and the Rapid MVP approach applies that same discipline to shipping a testable version of a product or page fast enough to learn from real users quickly.
Three takeaways from that approach apply regardless of who runs your program:
- Diagnose before you design. Behavioral data and user research should drive what gets built, not the reverse.
- Ship a testable version fast, then let real user behavior tell you what to fix next.
- Treat conversion work as a dedicated service line, not a side task squeezed into a broader project.
Readers who want applied detail can look at how Uber’s team reduced ride-booking friction or how Booking.com uses proof placement to reduce hesitation at the point of decision.
An Editorial Take on the First 30 and 90 Days
If you’re starting from nothing, resist the urge to test buttons. Spend the first two weeks diagnosing whether your primary page actually communicates value clearly, using session recordings and a handful of real user interviews. In the first 30 days, run two experiments at most: one on headline and offer clarity, one on the single biggest form or navigation friction point you’ve documented. By 90 days, you should have three completed tests logged, wins or losses, and a prioritized backlog built from evidence instead of opinion. The teams that skip diagnosis and jump straight to testing are the ones still guessing a year later.
Get a Structured Conversion Audit Instead of Guessing
An alternative to running CRO by trial and error is getting a structured diagnosis built on a research-first process, run by a team experienced across tech, SaaS, finance, and ecommerce clients.

If you’ve read this far and recognize your own site in the mistakes above (testing cosmetics before clarity, no guardrail metrics, no test registry), the fastest way to correct course isn’t another blog post. Start with the Free UX Audit, which diagnoses friction on your highest-value page the same way this article recommends: behavioral data first, hypotheses second. If you want ongoing support running the process end to end, the Conversion Rate Optimisation service picks up from there, and teams that want a faster, lower-commitment starting point can join the free 3-day Conversion Uptake Program to see the diagnosis-first approach in action before committing to anything larger.
Get a UX & CRO Expert’s Eyes on Your Website. Book a free 30-minute UX Teardown and get actionable insights on what’s costing you conversions — no fluff, just fixes you can implement right away.
Book a Free UX Audit

Related posts

How Typography Hierarchy Boosts UI Usability
People do not read interfaces the way they read books. They scan, evaluate, and act. Nielsen Norman Group has consistently […]

What is Service Design & How can it Benefit Your Business
What is Service Design? As a term coined by Lynn Shostack in 1982, Service Design was initially proposed to organisations […]

How IKEA Uses 4 UX Strategies to Simplify Complex Buying Decisions
IKEA UX is one of the strongest examples of how thoughtful design can make a complex buying journey feel simple, […]
Creative product design that gets results
Take your company to the next level with world class user experience and interface design.
get a free strategy session
